


RORE
The England & Wales water companies yesterday published information about their financial performance in 2024/25. How can we best measure and then compare how they fared?
We could start by looking at the profits and losses recorded in the companies’ accounts. However, this is going to be unsatisfactory for a couple of reasons:
First, current accounting standards struggle to deal with modern-day regulatory incentives and sharing rules.* In particular, in most cases, the accounts will not reflect properly any deferred revenues or payments that will become due in later years as a result of performance and economic conditions in the year that has just been completed, thus giving an incomplete picture of the firm’s overall financial position;** and
Second, even if we could rely on the P&Ls, raw £m figures aren’t in and of themselves especially meaningful, particularly if we’re trying to making cross-company comparisons - i.e. a £100m profit might be quite significant for a small company but comparatively trivial for a much larger firm.
This is where the concept of Return on Regulatory Equity or RORE comes in useful.
RORE is a fairly recent creation which measures companies’ performance using regulator-designed ‘regulatory accounting guidelines’ rather than formal accounting standards. These guidelines essentially take a company’s out-turns through the regulator’s price control rule book and identify how the company can be said to have performed once one takes account of all of the regulator’s different incentives and true-up mechanisms.
RORE is then ultimately expressed in % terms rather than £m terms so as to facilitate comparisons over time and between firms. The chosen denominator relies on the value of a company’s regulatory asset base (RAB) as a measure of the firm’s basic size. Specifically, RORE measures financial performance in terms of a % return on the portion of the RAB that a typical or notional company might finance via equity. This means that the focus is ultimately on profits or losses accruing to shareholders.
To fix ideas, suppose that a firm has a totex allowance of £100m and a 50:50 totex sharing rule in which under- and over-spending is to be split 50:50 between company and customers. Suppose also that the value of the firm’s RAB is £1 billion and that the notional amount of equity financing is £400m.
If the firm spent £120m, we would say that this is equivalent to under-performance worth [(£100m - £120m) x 50%] / £400m = -2.5% of RORE.
Similarly, if the firm spent £90m, this would be equivalent to out-performance worth [(£90m - £100m) x 50%] / £400m = +1.25% of RORE.
What does the RORE measure tell us about water companies’ performance in 2024/25?
The chart below shows first of all the under- and out-performance that companies generated as a result of their expenditures and service/environmental outcomes.***
Water company operational out- and under-performance, annual RORE 2024/25
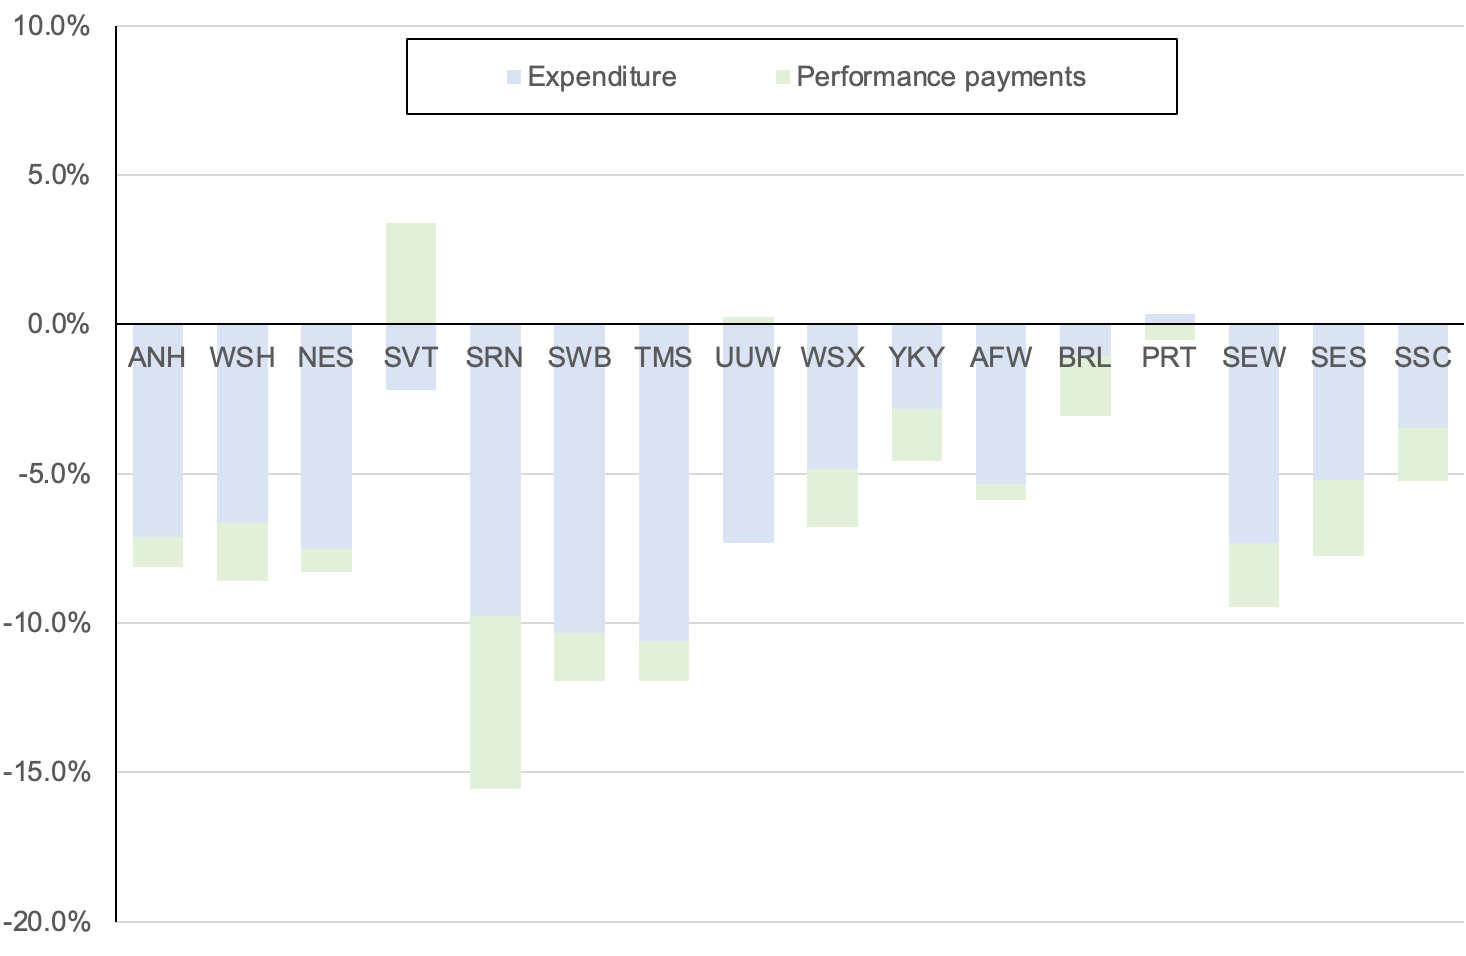
The chart shows at a glance that most companies struggled with their totex allowances and ODIs last year. Only one company - Severn Trent - out-performed overall. The other companies in the sector lost profit (with several companies suffering very substantial losses of return).
We can also look at financing performance via the RORE measure. The next chart, for instance, adds a third bar that measures the profits earned or lost as a result of the companies’ use of debt finance.
Water company operational and debt financing out- and under-performance, annual RORE 2024/25

The yellow bars in this chart shows that some companies were able to partly offset their operational under-performance with debt out-performance (in some cases because they paid interest rates that were lower than Ofwat’s allowed cost of debt, but principally because of high inflation and the inflation leverage effect that I highlighted in an earlier post).
RORE isn’t just used as a gauge of out-turn financial performance either. Pick up an Ofgem or an Ofwat price review document and you’ll encounter multiple references to RORE in the regulators’ ex ante calibration of companies’ price controls.
When, for example, a regulator wants to explain the size of a new financial incentive, it will often talk about potential rewards and potential penalties in terms of a maximum +/- xx basis points of RORE.
When a regulator is explaining the design of a new sharing mechanism, it might say that sharing will begin once a firm’s under- or out-performance exceeds +/- yy basis points of RORE.
And so on and so forth.
The consequence this has is that RORE has increasingly become the yardstick of choice in both the regulatory world and the real world. My advice as a regulatory practitioner is: unless you know a company’s finances like the back of your hand, thinking wherever possible in terms of RORE rather than £m figures often illuminates what can otherwise be quite murky waters.
Notes:
* The International Accounting Standards Board is currently working on a project that is intended to address some of the issues that are affecting rate-regulated entities’ accounting.
** I co-authored a paper last year with the UK Endorsement Board’s secretariat that explores some of these problems.
*** The denominator in these RORE calculations use a notional 60:40 debt:equity mix.